Fig. 1
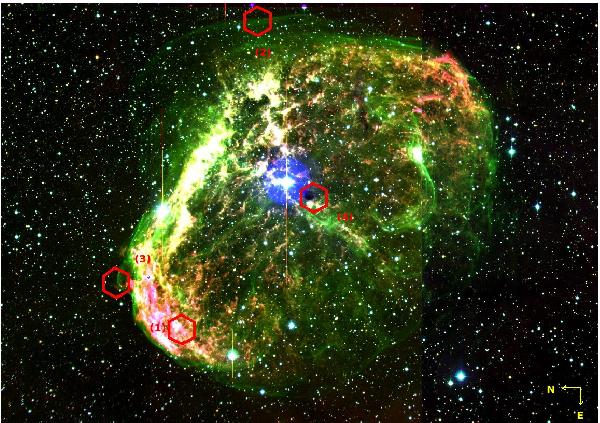
RGB composited image of NGC 6888 taken with the WFC at the Isaac Newton Telescope (INT). Red corresponds to the Hα emission, green to [OIII], and blue to [OII]. [OII] emission is very faint but noticeable as the pink shade in the mix of Hα and [OII]. North is left and east at the bottom. Red hexagons show the zones of our IFS observations: (1) X-ray, (2) edge, (3) mini-bubble, and (4) bullet.
Current usage metrics show cumulative count of Article Views (full-text article views including HTML views, PDF and ePub downloads, according to the available data) and Abstracts Views on Vision4Press platform.
Data correspond to usage on the plateform after 2015. The current usage metrics is available 48-96 hours after online publication and is updated daily on week days.
Initial download of the metrics may take a while.