Fig. 7
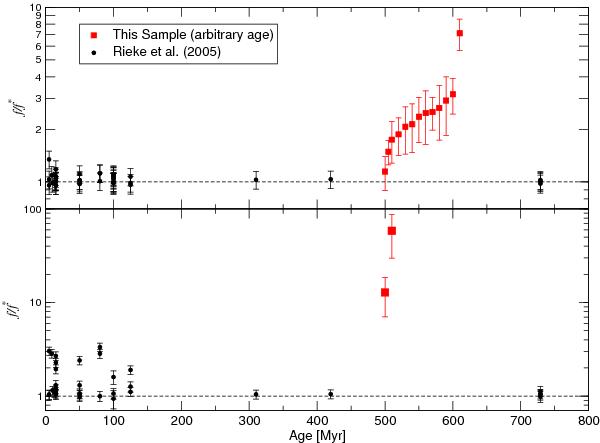
Excess as a function of time. The top plot shows the evolution of F12/F∗, the observed WISE flux as a fraction of the predicted stellar flux, as a function of time. The bottom plot shows the analogous quantity for 22 μm. The stellar sample is based on the WISE measurements of the Rieke et al. (2005) sample. The red points show the position of the candidates we present here. The ages of the KIC sample are generally unknown. We have arbitrarily assumed ages between 500 and 600 Myrs. To facilitate the comparison we have also set WASP-46 in this range.
Current usage metrics show cumulative count of Article Views (full-text article views including HTML views, PDF and ePub downloads, according to the available data) and Abstracts Views on Vision4Press platform.
Data correspond to usage on the plateform after 2015. The current usage metrics is available 48-96 hours after online publication and is updated daily on week days.
Initial download of the metrics may take a while.