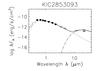
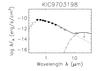
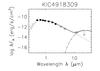
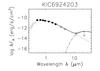
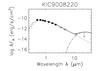
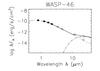
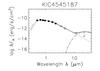
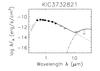
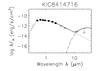
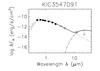
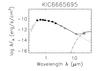
Fig. 6
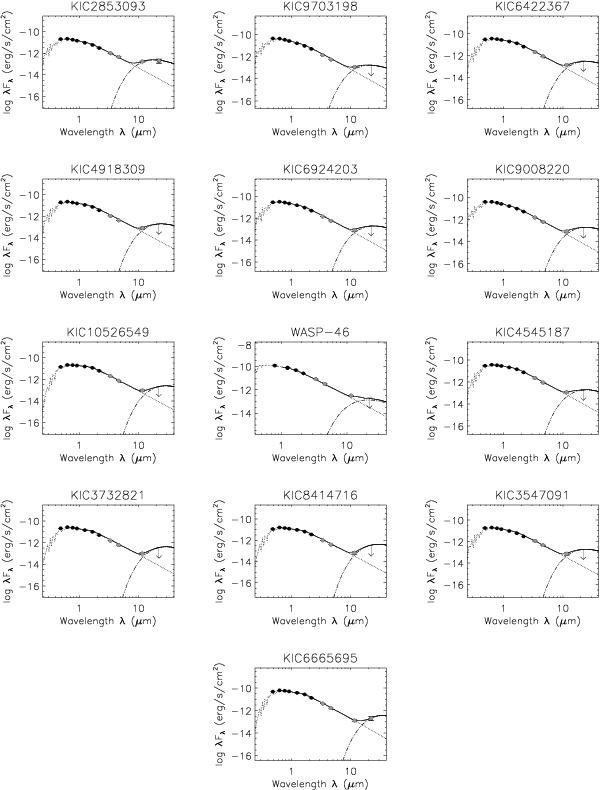
SEDs of the selected candidates. The fitted dereddened photometry (solid line), optical and 2MASS (black dots) and WISE (grey dots) are represented. A photosphere (dotted line) is fitted to the 2MASS and W1 and W2 bands and the thin line represents the total of stellar plus excess emissions. Arrows represent W4 upper limits.


Current usage metrics show cumulative count of Article Views (full-text article views including HTML views, PDF and ePub downloads, according to the available data) and Abstracts Views on Vision4Press platform.
Data correspond to usage on the plateform after 2015. The current usage metrics is available 48-96 hours after online publication and is updated daily on week days.
Initial download of the metrics may take a while.