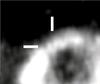
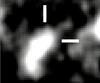
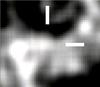
Fig. 3
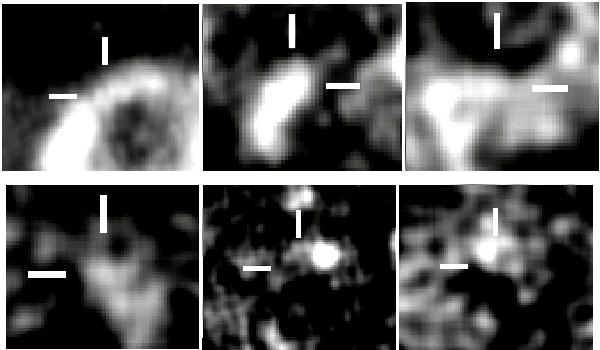
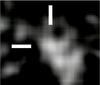
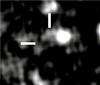
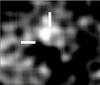
Here and in the next two figures, north is up and east is left. Each image is 1.7′ × 1.9′. The thick segments indicate the nominal position of the target in the WISE catalog. The color scale goes from zero to 3σ, where the sigma is calculated as the standard deviation of the pixels in the image. Examples of different problems in the images: (top left) artifact in the W3 band for CoRoT-14; (top middle) extended PSF in W3 for KIC 11288505; (top right) extended PSF possibly due to source confusion in W4 for KIC 6692833; (bottom left) extended PSF possibly due to low S/N in W4 for KIC 2309719; (bottom center) photocenter offset in W3 and (bottom right) W4 for KIC 9007866.
Current usage metrics show cumulative count of Article Views (full-text article views including HTML views, PDF and ePub downloads, according to the available data) and Abstracts Views on Vision4Press platform.
Data correspond to usage on the plateform after 2015. The current usage metrics is available 48-96 hours after online publication and is updated daily on week days.
Initial download of the metrics may take a while.