Free Access
Fig. 6
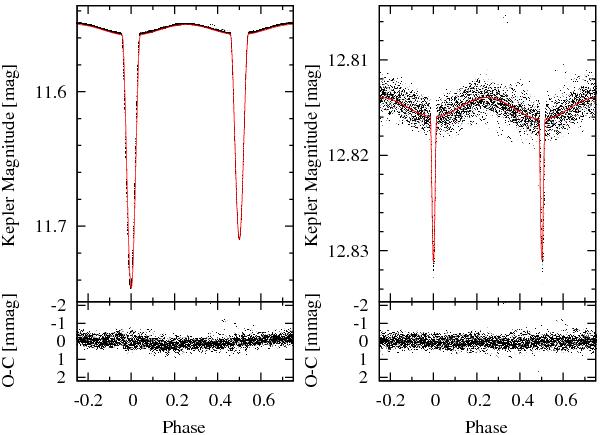
Disentangled and phase-folded light curves. Left: light curve (EB II model subtracted) fitted by the EB I model. Right: light curve (EB I model subtracted) fitted by the EB II model. The corresponding O − C residuals are shown in the lower panels.
This figure is made of several images, please see below:
Current usage metrics show cumulative count of Article Views (full-text article views including HTML views, PDF and ePub downloads, according to the available data) and Abstracts Views on Vision4Press platform.
Data correspond to usage on the plateform after 2015. The current usage metrics is available 48-96 hours after online publication and is updated daily on week days.
Initial download of the metrics may take a while.