Fig. 9
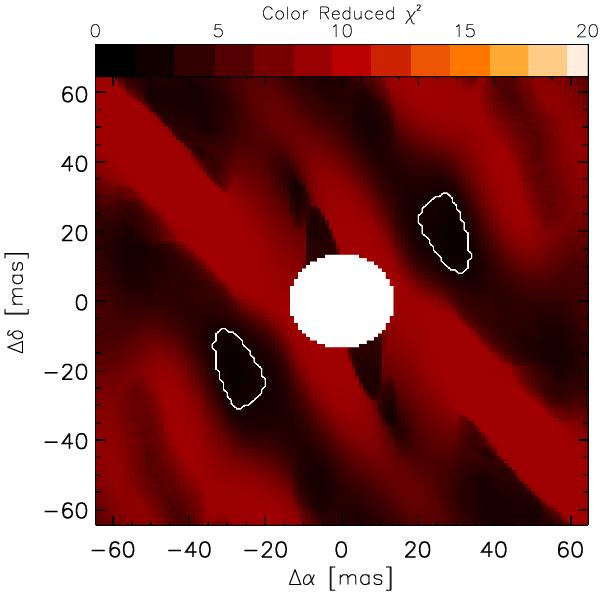
Color-reduced χ2 map for the grid of
wavelength-independent parameters of position of the binary component. The white
area in the middle marks the region where the primary component is located. In
this part, no fitting was performed. White contours are drawn at
 indicating the 68%
confidence level.
indicating the 68%
confidence level.
Current usage metrics show cumulative count of Article Views (full-text article views including HTML views, PDF and ePub downloads, according to the available data) and Abstracts Views on Vision4Press platform.
Data correspond to usage on the plateform after 2015. The current usage metrics is available 48-96 hours after online publication and is updated daily on week days.
Initial download of the metrics may take a while.