Fig. 3
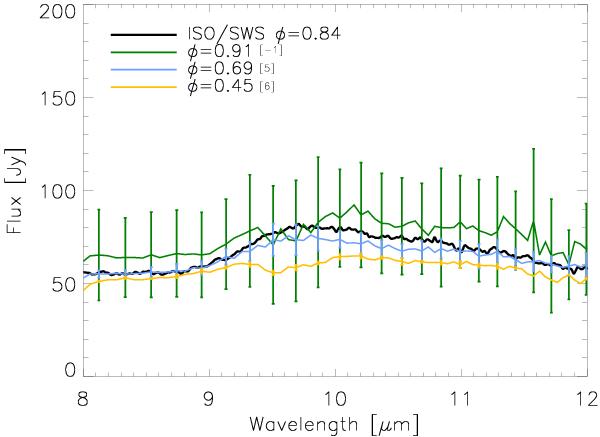
Averaged MIDI flux (thin full lines) for different visual phases and overplotted ISO/SWS flux (thick black full line) of SV Psc in the N-band. Error bars denote the standard deviation of all observed fluxes for the respective night and telescope. The ISO SWS spectrum was observed in 1998 (i.e. 33 cycles before the first MIDI observations).
Current usage metrics show cumulative count of Article Views (full-text article views including HTML views, PDF and ePub downloads, according to the available data) and Abstracts Views on Vision4Press platform.
Data correspond to usage on the plateform after 2015. The current usage metrics is available 48-96 hours after online publication and is updated daily on week days.
Initial download of the metrics may take a while.