Fig. 12
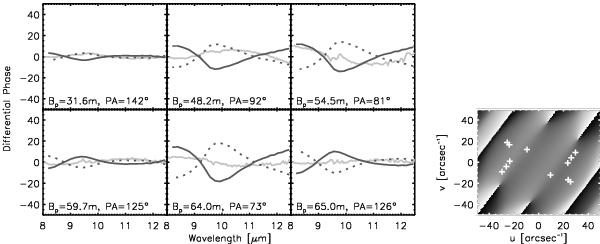
Best-fitting binary-model differential phases (dark-grey full and dotted line corresponding to upper right and lower left solution in Fig. 9, respectively) superimposed on the calibrated MIDI differential phases (light-grey line). Lower right plot: modeled phase distribution in the uv-plane at 10 μm plotted with the uv-coverage of the observations.
Current usage metrics show cumulative count of Article Views (full-text article views including HTML views, PDF and ePub downloads, according to the available data) and Abstracts Views on Vision4Press platform.
Data correspond to usage on the plateform after 2015. The current usage metrics is available 48-96 hours after online publication and is updated daily on week days.
Initial download of the metrics may take a while.