Fig. 9
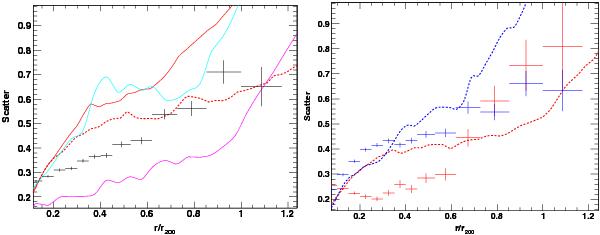
Left: comparison between the average observed azimuthal scatter profile from Fig. 7 (black) and the scatter in the simulations for the ENZO runs (red), for the total scatter (solid line) and when filtering out the 1% most-luminous cells (dashed curve). The cyan (NR) and magenta (CSF) curves represent the scatter in the ART simulations. Right: same for the CC (red) and NCC (blue) observed profiles, compared to the 1%-filtered ENZO profiles for the morphologically relaxed (red) and disturbed (blue) simulated clusters.
Current usage metrics show cumulative count of Article Views (full-text article views including HTML views, PDF and ePub downloads, according to the available data) and Abstracts Views on Vision4Press platform.
Data correspond to usage on the plateform after 2015. The current usage metrics is available 48-96 hours after online publication and is updated daily on week days.
Initial download of the metrics may take a while.