Free Access
Fig. 2
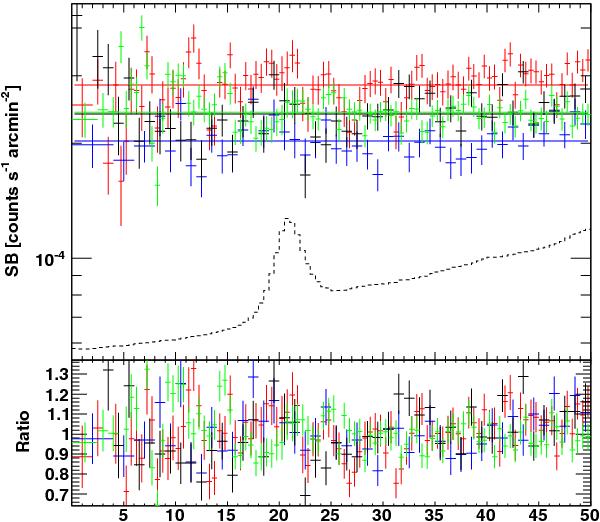
Surface-brightness profiles for 4 blank-field PSPC observations from the center of the FOV, fitted with a constant. The dashed line shows the vignetting correction curve for comparison, in arbitrary units; the bump at ~22 arcmin is caused by the support structure. The bottom panel shows the ratio between data and model.
Current usage metrics show cumulative count of Article Views (full-text article views including HTML views, PDF and ePub downloads, according to the available data) and Abstracts Views on Vision4Press platform.
Data correspond to usage on the plateform after 2015. The current usage metrics is available 48-96 hours after online publication and is updated daily on week days.
Initial download of the metrics may take a while.