Fig. 3
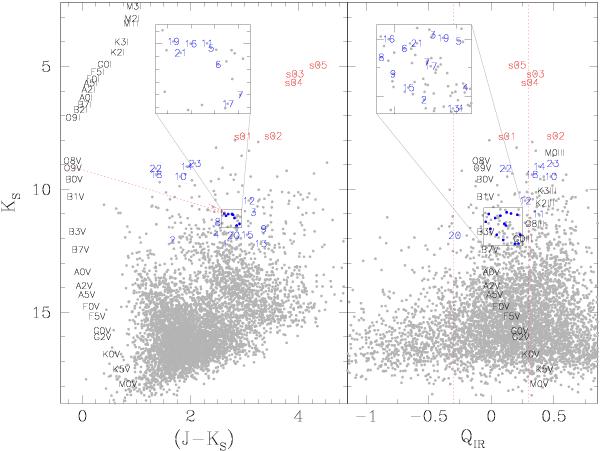
Calibrated colour–magnitude (left) and free-reddening parameter-magnitude (right) diagrams for Masgomas-1. The red segmented arrow in the left panel shows AKS = 3.00. Main sequence and supergiant sequence, shown in black, are located without reddening at the distance determined in this study (3.53 kpc). In the right panel the red segmented lines show the limit for the QIR parameter used in the systematic search. The expected QIR and KS magnitude for the dwarf and giant sequences located at the distance determined in this study (3.53 kpc) are also shown in black. In both diagrams the positions of the spectroscopically observed stars are marked with blue (multi-object spectroscopy) and red numbers (long-slit spectroscopy). We marked the stars located in the central regions of both diagrams with blue circles and amplified the regions in the upper squares, where the observed stars are marked with blue numbers. We used visual magnitudes and intrinsic colours from Cox (2000) for deriving the dwarf, giant, and supergiant sequences.
Current usage metrics show cumulative count of Article Views (full-text article views including HTML views, PDF and ePub downloads, according to the available data) and Abstracts Views on Vision4Press platform.
Data correspond to usage on the plateform after 2015. The current usage metrics is available 48-96 hours after online publication and is updated daily on week days.
Initial download of the metrics may take a while.