Free Access
Fig. 8
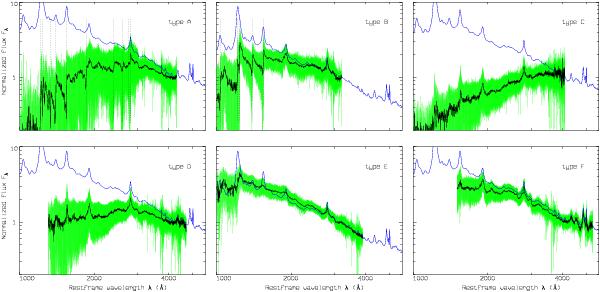
Arithmetic median composite spectra for types A to F. For comparison the SDSS quasar composite spectrum from Vanden Berk et al. (2001) is shown, arbitrarily normalised at the red end. The dashed vertical lines indicate the strongest absorption lines for types A and B.
Current usage metrics show cumulative count of Article Views (full-text article views including HTML views, PDF and ePub downloads, according to the available data) and Abstracts Views on Vision4Press platform.
Data correspond to usage on the plateform after 2015. The current usage metrics is available 48-96 hours after online publication and is updated daily on week days.
Initial download of the metrics may take a while.