Free Access
Fig. 1
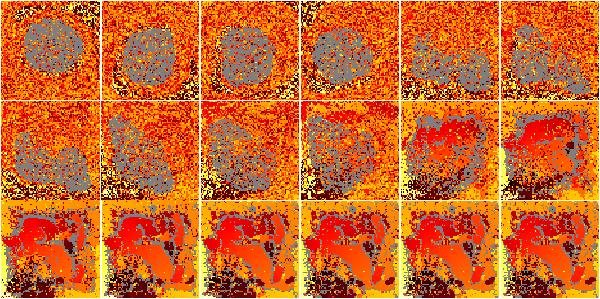
Temporal evolution (left to right then top to bottom) of the Kohonen SOM of 5 × 10³ SDSS quasar spectra. The quasar redshifts are highlighted by means of colour coding. The gradient from dark (black) to bright (light yellow) represents the range from low to high redshift.
Current usage metrics show cumulative count of Article Views (full-text article views including HTML views, PDF and ePub downloads, according to the available data) and Abstracts Views on Vision4Press platform.
Data correspond to usage on the plateform after 2015. The current usage metrics is available 48-96 hours after online publication and is updated daily on week days.
Initial download of the metrics may take a while.