Fig. 3
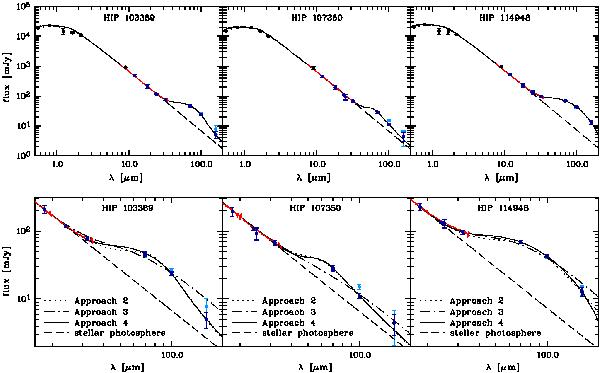
Observed and modeled SEDs of the three sources. The Spitzer/IRS spectrum is plotted in red. The data points considered for the fitting are shown in dark blue. The PACS data considered are from Reduction 1, while the results from Reduction 2 are plotted in light blue for comparison. Top: final models from the SAnD approaches. The modeled SEDs (solid line) for the three disks are computed from the results of Approach 4 using pure astronomical silicate (Sect. 5). The dashed line in each panel represents the model stellar photosphere. Bottom: comparison between the best-fit results from the different approaches. The modeled SEDs are computed from the best-fit result of each approach using pure astronomical silicate. The results from Approach 1 are not included, since the best-fit results are found not to be in the explored range of parameters in this approach.
Current usage metrics show cumulative count of Article Views (full-text article views including HTML views, PDF and ePub downloads, according to the available data) and Abstracts Views on Vision4Press platform.
Data correspond to usage on the plateform after 2015. The current usage metrics is available 48-96 hours after online publication and is updated daily on week days.
Initial download of the metrics may take a while.