Fig. 1
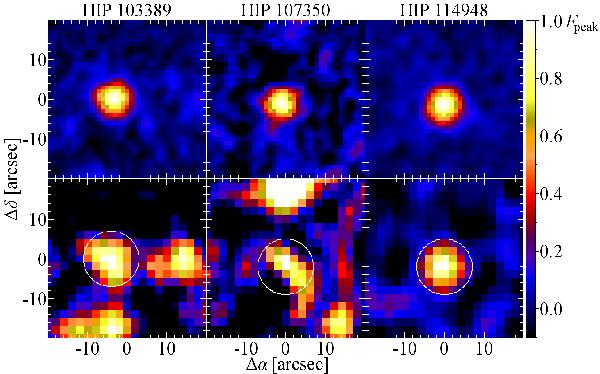
Images of the three sources at 100 μm (top) and 160 μm (bottom) from Reduction 1 (Sect. 2). The images are displayed in a linear stretch from −0.1 Fpeak to Fpeak of the source of interest. The peak flux is 0.38 mJy/pixel, 0.23 mJy/pixel, and 0.54 mJy/pixel at 100 μm and 0.17 mJy/pixel, 0.16 mJy/pixel, and 0.45 mJy/pixel at 160 μm for HIP 103389, HIP 107350, and HIP 114948, respectively. The white circles in the 160 μm images are centered on the brightest pixel of the source, respectively.
Current usage metrics show cumulative count of Article Views (full-text article views including HTML views, PDF and ePub downloads, according to the available data) and Abstracts Views on Vision4Press platform.
Data correspond to usage on the plateform after 2015. The current usage metrics is available 48-96 hours after online publication and is updated daily on week days.
Initial download of the metrics may take a while.