Fig. 4
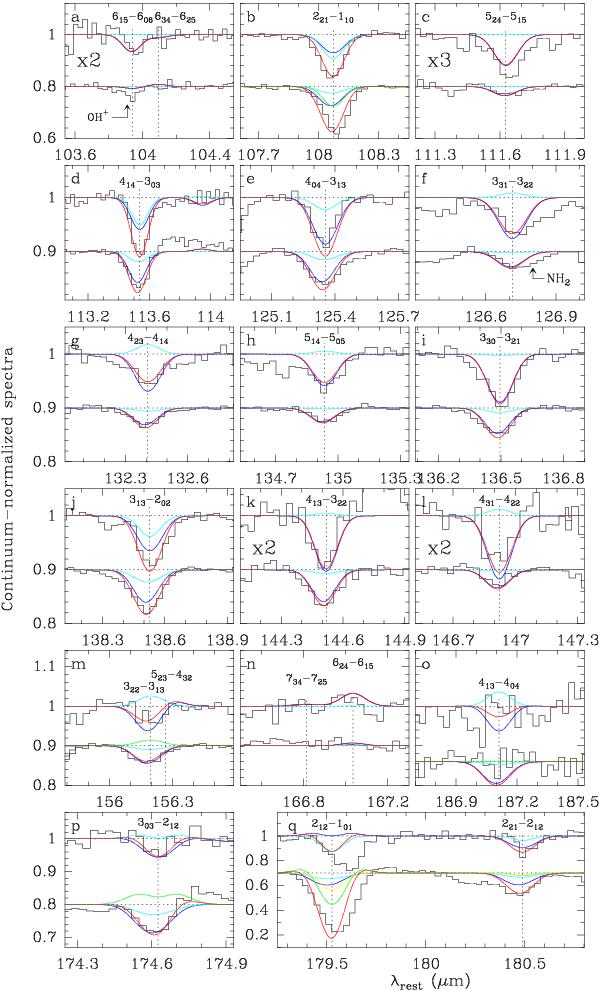
H2O lines in the red band (λ > 100 μm) detected in NGC 4418 (upper spectra in each panel) and Arp 220 (lower spectra). The spectra have been scaled by a factor of 2 in panels a), k) and l), and by 3 in panel c). Model results are also shown. Color codes for the contributions of the different components are given in Fig. 3, with the yellow curve in panel q) showing the additional contribution by the halo component (Chalo) in front of the nuclear region of Arp 220.
Current usage metrics show cumulative count of Article Views (full-text article views including HTML views, PDF and ePub downloads, according to the available data) and Abstracts Views on Vision4Press platform.
Data correspond to usage on the plateform after 2015. The current usage metrics is available 48-96 hours after online publication and is updated daily on week days.
Initial download of the metrics may take a while.