Fig. 15
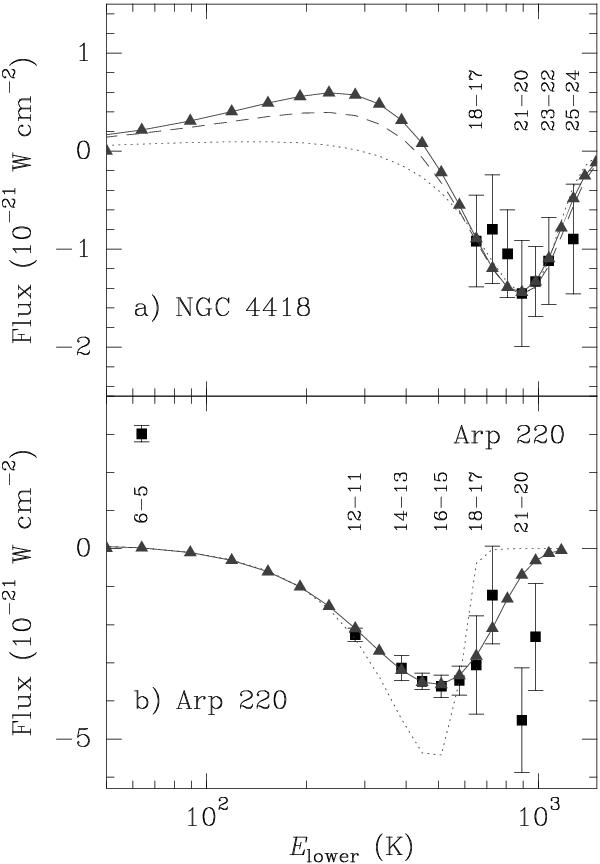
HCN line fluxes in NGC 4418 a) and Arp 220 b). In Arp 220, the fluxes of lines with Elower up to 570 K have been taken from SPIRE-FTS data (Rangwala et al. 2011). The curves and triangles show model predictions for the Ccore component of NGC 4418 and the Cwest component of Arp 220. The dotted curve in b) shows results obtained when only collisional excitation is included in the model. The solid curve in a) shows the best fit model obtained with τ200 ≈ 1, while the dashed and dotted curves correspond to τ200 = 4 with and without gas-dust mixing, respectively.
Current usage metrics show cumulative count of Article Views (full-text article views including HTML views, PDF and ePub downloads, according to the available data) and Abstracts Views on Vision4Press platform.
Data correspond to usage on the plateform after 2015. The current usage metrics is available 48-96 hours after online publication and is updated daily on week days.
Initial download of the metrics may take a while.