Fig. 12
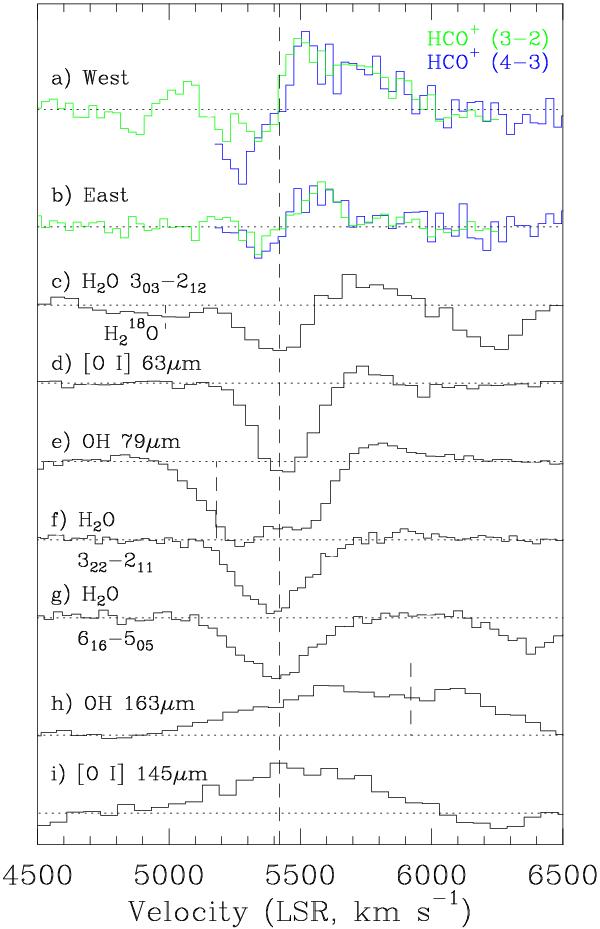
Comparison between the line shapes of the HCO+J = 3 → 2
(green histograms) and J = 4 → 3 (blue histograms) transitions
toward a) the western and b) eastern nucleus of Arp 220
(from Sakamoto et al. 2009), with selected
lines detected with Herschel/PACS (c–i).
The dashed vertical line indicates our adopted systemic velocity (Sect. 2.2). The velocity scale for the OH 79
(163) μm doublet is relative to the red (blue) Λ-component, and
the systemic velocity for the other Λ-component is also indicated. The velocity of
the  O
303 → 212 line in c) is also indicated.
O
303 → 212 line in c) is also indicated.
Current usage metrics show cumulative count of Article Views (full-text article views including HTML views, PDF and ePub downloads, according to the available data) and Abstracts Views on Vision4Press platform.
Data correspond to usage on the plateform after 2015. The current usage metrics is available 48-96 hours after online publication and is updated daily on week days.
Initial download of the metrics may take a while.