Fig. 11
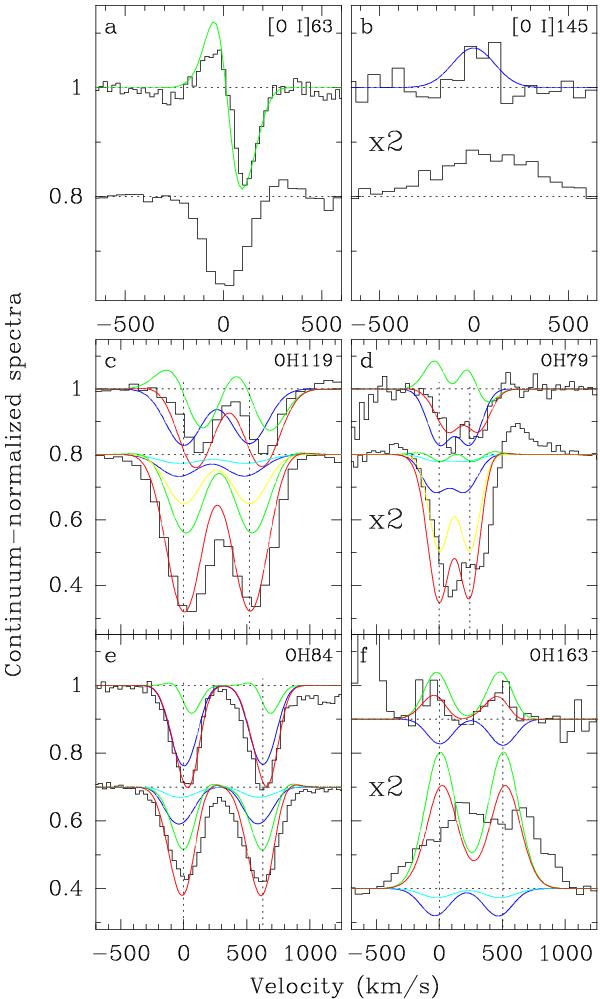
Line profiles of the [O i] 63 and 145 μm (a and b) transitions compared with those of some OH lines (c)–f)). Upper histograms, NGC 4418; lower histograms, Arp 220. Model predictions are also included. For NGC 4418, the blue curves show the combined contribution of the Ccore and Cwarm components, and the green curves show the model for Cextended . For Arp 220, see caption of Fig. 6. Red denotes the total of all components.
Current usage metrics show cumulative count of Article Views (full-text article views including HTML views, PDF and ePub downloads, according to the available data) and Abstracts Views on Vision4Press platform.
Data correspond to usage on the plateform after 2015. The current usage metrics is available 48-96 hours after online publication and is updated daily on week days.
Initial download of the metrics may take a while.