Fig. 8
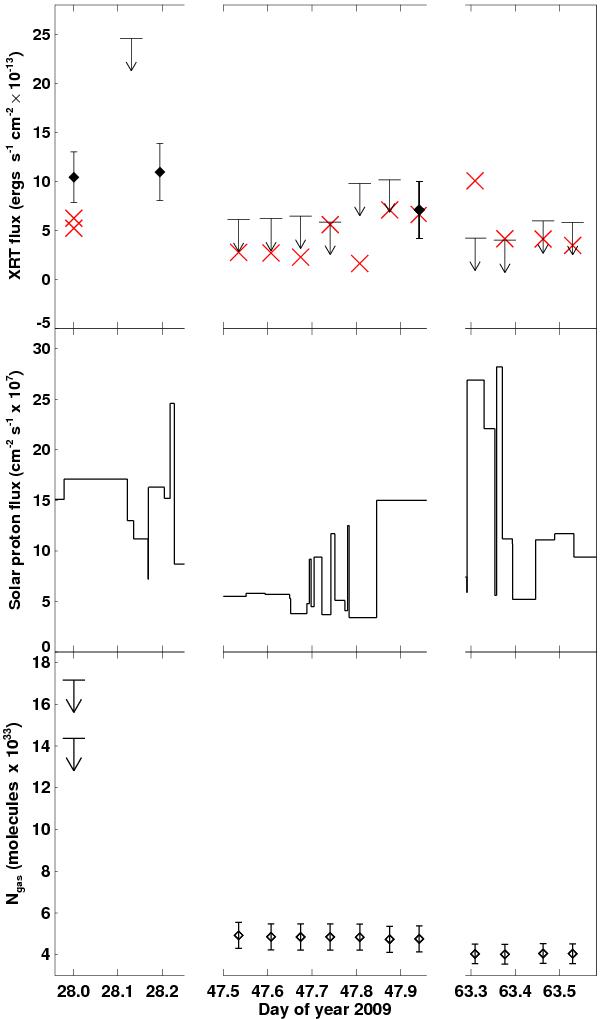
Upper panel: XRT 0.3 to 1 keV background-corrected fluxes (diamonds) or upper limits (downward arrows) where appropriate, plotted against a time-axis given in the day of year. We also plot the predicted X-ray flux (red crosses, normalised to the tenth observation) as described in the text. Middle panel: solar wind proton flux as measured by STEREO A for early 2009. Lower panel: Ngas (open diamonds), or upper limits (downward arrows) where appropriate.
Current usage metrics show cumulative count of Article Views (full-text article views including HTML views, PDF and ePub downloads, according to the available data) and Abstracts Views on Vision4Press platform.
Data correspond to usage on the plateform after 2015. The current usage metrics is available 48-96 hours after online publication and is updated daily on week days.
Initial download of the metrics may take a while.