Fig. 6
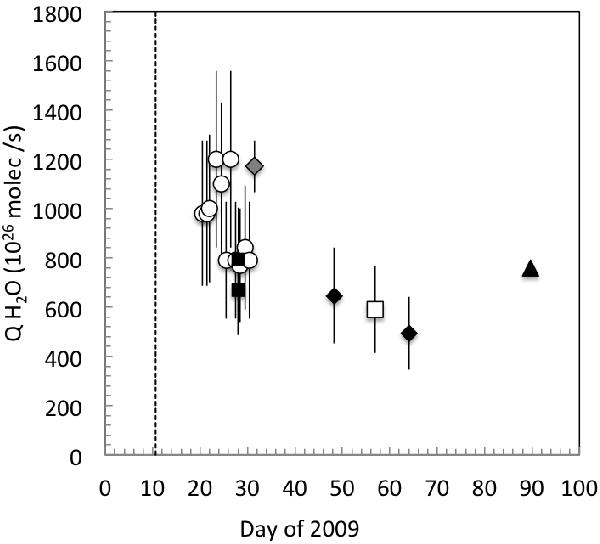
Gas production rates of H2O vs time, calculated for our observing periods on 2009-02-16 and 2009-03-04 (solid, black diamonds). We also plot H2O production rates from Combi et al. (2009, circles), Schleicher (2009, priv. comm., open squares), Bodewits et al. (2011, filled squares), Ootsubo et al. (2010, filled triangle) and Bonev et al. (2009, solid, grey diamond). The dashed vertical line indicates the date of the perihelion passage of the comet.
Current usage metrics show cumulative count of Article Views (full-text article views including HTML views, PDF and ePub downloads, according to the available data) and Abstracts Views on Vision4Press platform.
Data correspond to usage on the plateform after 2015. The current usage metrics is available 48-96 hours after online publication and is updated daily on week days.
Initial download of the metrics may take a while.