Fig. 5
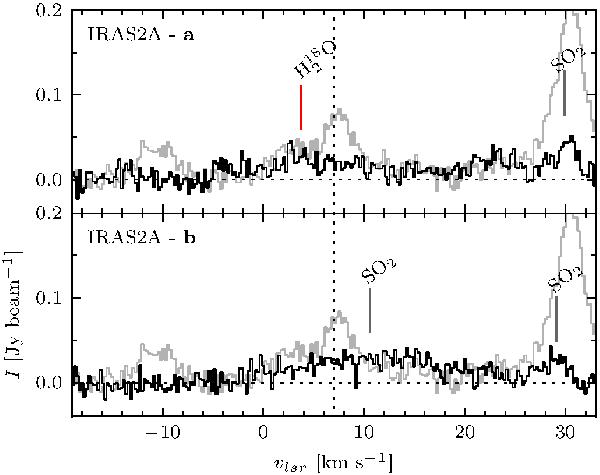
IRAS2A off-position spectra, averaged over 1′′ × 1′′ regions around the positions marked with “a” and “b” in Fig. 2 in the blueshifted outflow from the imaged data. The spectra have been rebinned to twice the velocity resolution (width of 0.23 km s-1). The systemic velocity of the H O line is drawn with a vertical dotted line at vlsr = 7 km s-1, and the gray outline in the background is the on-source spectrum averaged in a region of the same size as the other spectra.
Current usage metrics show cumulative count of Article Views (full-text article views including HTML views, PDF and ePub downloads, according to the available data) and Abstracts Views on Vision4Press platform.
Data correspond to usage on the plateform after 2015. The current usage metrics is available 48-96 hours after online publication and is updated daily on week days.
Initial download of the metrics may take a while.