Fig. 2
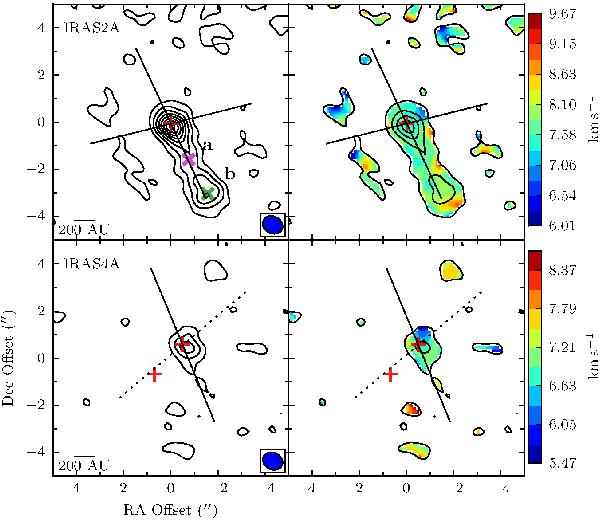
Integrated intensity (left) and velocity (right) maps for the H O 31,3 − 22,0 line in IRAS2A (from 4.4 to 11.4 km s-1) and IRAS4A (from 4.7 to 9.6 km s-1). Contours show integrated intensity and are in steps of 4σ for the intensity map, 8σ for the velocity map, and start at 3σ. The position of the continuum emission is marked by a red plus sign, an outflow by the solid line and maser emission by the dashed line. Positions where spectra have been extracted in IRAS2A along the outflow are marked with letters a and b and crosses with magenta and green colors in the integrated intensity map.
Current usage metrics show cumulative count of Article Views (full-text article views including HTML views, PDF and ePub downloads, according to the available data) and Abstracts Views on Vision4Press platform.
Data correspond to usage on the plateform after 2015. The current usage metrics is available 48-96 hours after online publication and is updated daily on week days.
Initial download of the metrics may take a while.