Free Access
Fig. 1
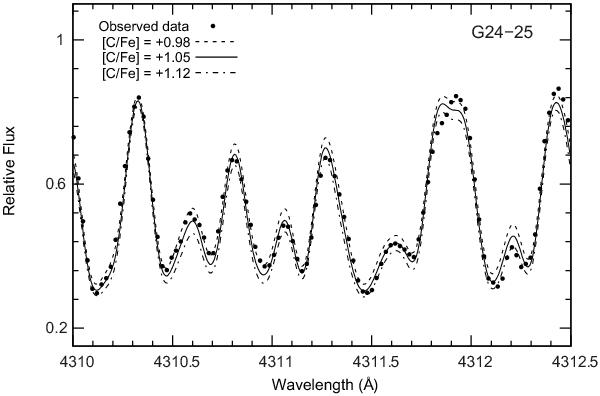
The CH feature near 4310 Å. The observed spectrum of G 24-25 is shown as bold dots. The solid line shows the synthetic spectrum corresponding to [C/Fe] = 1.05. The dot-dashed and dashed lines, corresponding to Δ[C/Fe] = ±0.07, are shown to illustrate the sensitivity of line strengths to variations in the carbon abundance.
Current usage metrics show cumulative count of Article Views (full-text article views including HTML views, PDF and ePub downloads, according to the available data) and Abstracts Views on Vision4Press platform.
Data correspond to usage on the plateform after 2015. The current usage metrics is available 48-96 hours after online publication and is updated daily on week days.
Initial download of the metrics may take a while.