Fig. 3
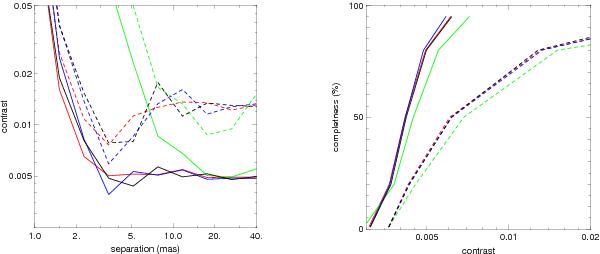
Left: 3-σ sensitivity versus separation for a completeness level of 80%. Right: completeness in the separation range 6−40 mas versus contrast. Simulations are for a single snapshot pointing (dashed lines) and for five pointings separated by one hour (solid lines). Colours are for the four configurations of VLTI displayed in Fig. 1. The contrast axes can be scaled for any given accuracy of the closure phase measurements (here σ = 0.25deg).
Current usage metrics show cumulative count of Article Views (full-text article views including HTML views, PDF and ePub downloads, according to the available data) and Abstracts Views on Vision4Press platform.
Data correspond to usage on the plateform after 2015. The current usage metrics is available 48-96 hours after online publication and is updated daily on week days.
Initial download of the metrics may take a while.