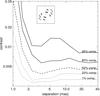
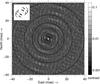
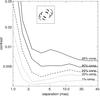
Fig. 2
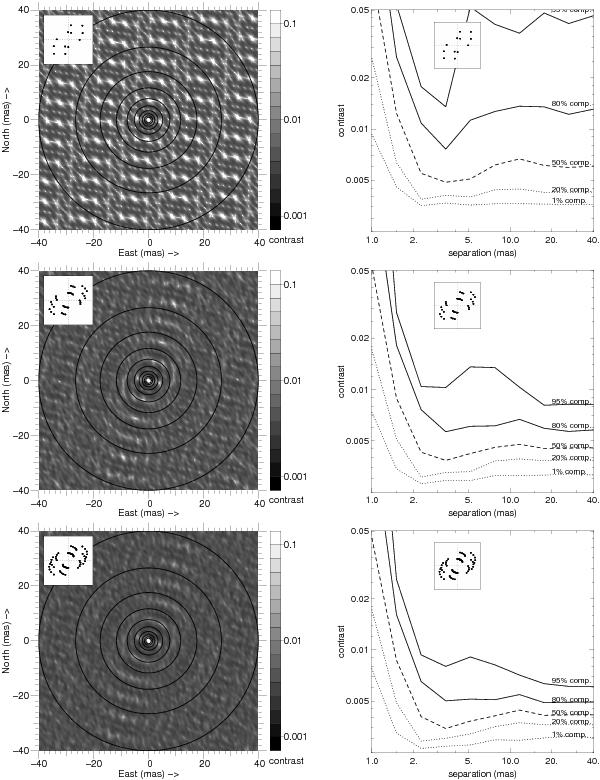
Left: map of the 3-σ sensitivity with the A1-K0-G1-I1 configuration from VLTI. Radial zones are the bins in separation used for the plots in the right panel. Right: sensitivity as a function of angular distance, for various completeness levels. From top to botom: simulations for a single snapshot pointing (top), and for three pointing (middle), and for five pointing (bottom). The contrast axes can be scaled for any accuracy on the closure phase (here σ = 0.25deg).
Current usage metrics show cumulative count of Article Views (full-text article views including HTML views, PDF and ePub downloads, according to the available data) and Abstracts Views on Vision4Press platform.
Data correspond to usage on the plateform after 2015. The current usage metrics is available 48-96 hours after online publication and is updated daily on week days.
Initial download of the metrics may take a while.