Fig. 8
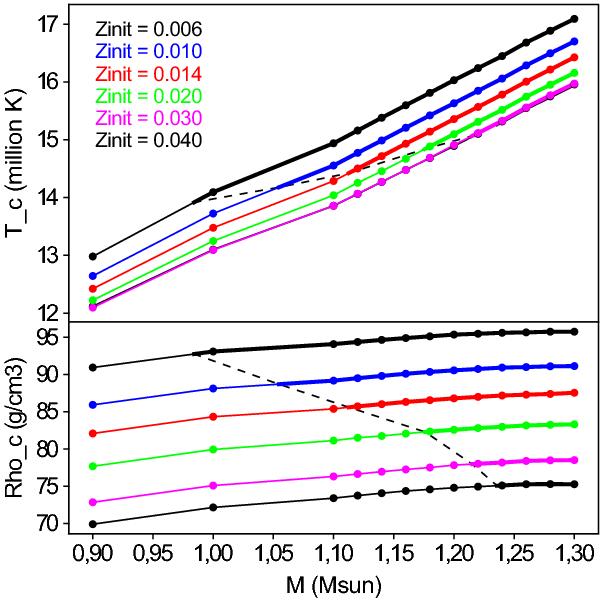
Upper panel: central temperature, in million Kelvin, at ZAMS of stellar models at different metallicities as a function of the stellar mass of the models. Each dot represents a computed model. The thick lines indicate the range of stellar masses for each metallicity, where a convective core is present on the ZAMS. The dotted line connects the core temperature at the lowest stellar mass having a convective core, for the different metallicities. Lower panel: same as upper panel, but for the central density.
Current usage metrics show cumulative count of Article Views (full-text article views including HTML views, PDF and ePub downloads, according to the available data) and Abstracts Views on Vision4Press platform.
Data correspond to usage on the plateform after 2015. The current usage metrics is available 48-96 hours after online publication and is updated daily on week days.
Initial download of the metrics may take a while.