Fig. 19
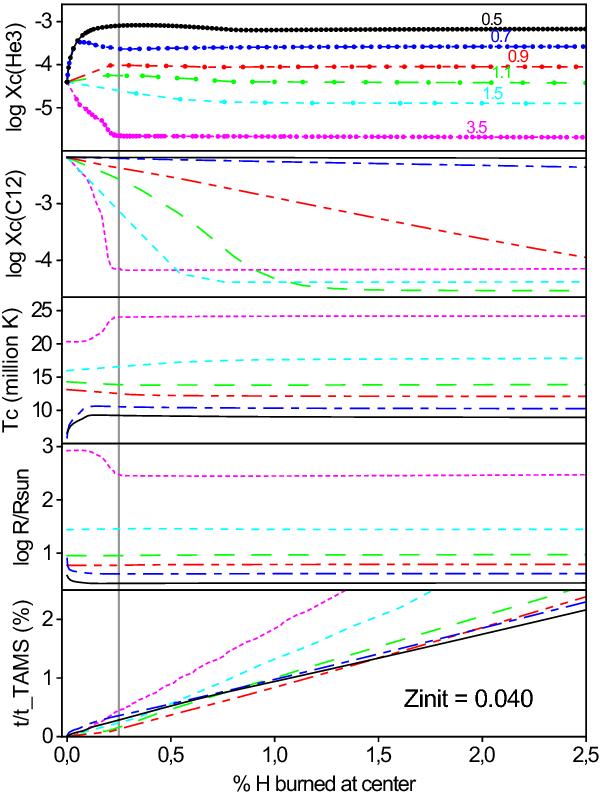
Evolution of several quantities in raw models at Zinit = 0.04 as a function of the percentage of hydrogen burned at the center. From top panel to bottom: logarithm of the 3He mass fraction at the center of the star log Xc(3He), log Xc(12C), core temperature in 106 K, logarithm of the stellar radius relative to the solar radius and percentage of time elapsed since the first raw model relative to the age at TAMS. Models of 0.5 (continuous lines), 0.7 (long-short dashed lines), 0.9 (long-short-short dashed lines), 1.1 (long dashed lines), 1.5 (short dashed lines), and 3.5 M⊙ (dotted lines) are displayed, as labeled in the top panel. Each marker in the top panel represents a computed model. The vertical line indicates the percentage of burned hydrogen taken to define the ZAMS in all our grids.
Current usage metrics show cumulative count of Article Views (full-text article views including HTML views, PDF and ePub downloads, according to the available data) and Abstracts Views on Vision4Press platform.
Data correspond to usage on the plateform after 2015. The current usage metrics is available 48-96 hours after online publication and is updated daily on week days.
Initial download of the metrics may take a while.