Fig. 16
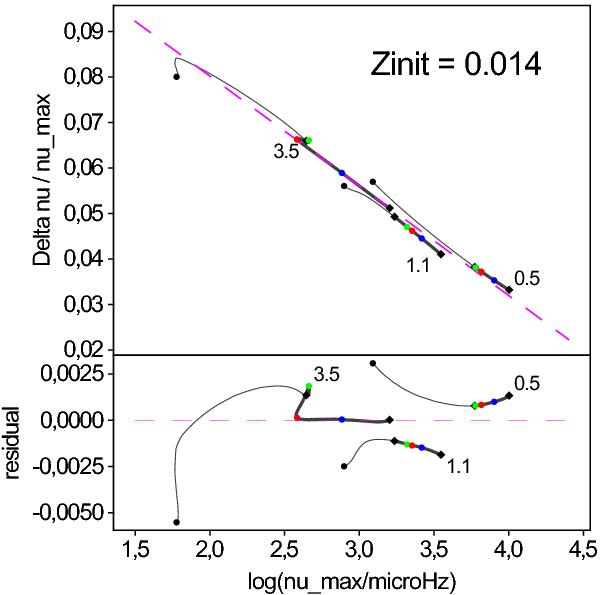
Top panel: evolutionary tracks at Zinit = 0.014 in the Δν/νmax versus log (νmax) diagram. For clarity, only the 0.5, 1.1, and 3.5 M⊙ tracks are plotted, as labeled next to the tracks. The main sequence is shown in thicker lines. The ZAMS is located on the right of each track. Reference points are indicated with symbols as in Fig. 1. The dashed line is a straight line passing through the ZAMS and the first MS hook of the 3.5 M⊙ star, given by Eq. (5). The frequencies are expressed in μHz. Bottom panel: same as top panel, but for the residual of Δν/νmax with respect to the straight line in the top panel.
Current usage metrics show cumulative count of Article Views (full-text article views including HTML views, PDF and ePub downloads, according to the available data) and Abstracts Views on Vision4Press platform.
Data correspond to usage on the plateform after 2015. The current usage metrics is available 48-96 hours after online publication and is updated daily on week days.
Initial download of the metrics may take a while.