Fig. 13
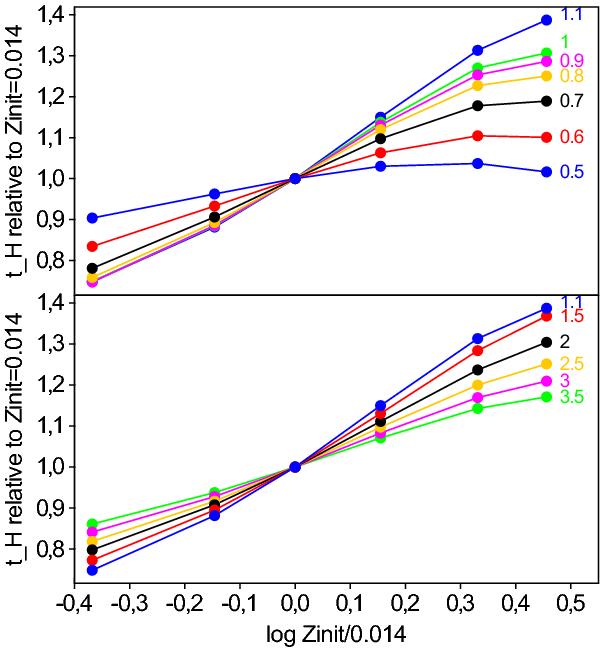
Upper panel: main sequence lifetimes as a function of the logarithm of the metallicity relative to solar, for models from 0.5 to 1.1 M⊙ (bottom to top curves) as labeled on the right of the curves. The lifetimes are normalized for each stellar mass to its value at Zinit = 0.014. Lower panel: same as upper panel, but for selected models from 1.1 to 3.5 M⊙ (top to bottom curves).
Current usage metrics show cumulative count of Article Views (full-text article views including HTML views, PDF and ePub downloads, according to the available data) and Abstracts Views on Vision4Press platform.
Data correspond to usage on the plateform after 2015. The current usage metrics is available 48-96 hours after online publication and is updated daily on week days.
Initial download of the metrics may take a while.