Fig. 2
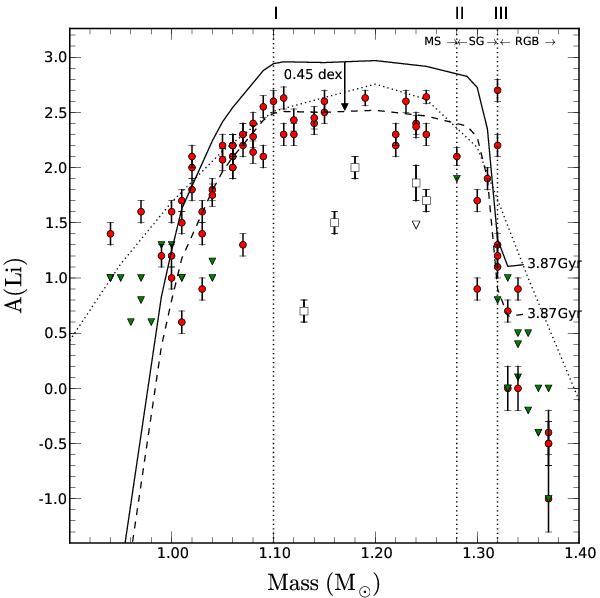
Lithium abundances as a function of stellar mass determined from the isochrone. Red filled circles represent stars with lithium abundance redetermined. The green triangles represent the lithium abundance upper limits. The open squares represents the deviant stars as discussed in Sect. 5.3. The continuous line corresponds to the lithium abundance predicted by our models with rotation-induced mixing calibrated for the Sun at the age of M 67. The dashed line represents the same model shifted by 0.45 dex to match the observed lithium plateau. The dotted line represents models with rotation-induced mixing calibrated on the Hyades. The roman numbers I − III are described in Sect. 5.1.
Current usage metrics show cumulative count of Article Views (full-text article views including HTML views, PDF and ePub downloads, according to the available data) and Abstracts Views on Vision4Press platform.
Data correspond to usage on the plateform after 2015. The current usage metrics is available 48-96 hours after online publication and is updated daily on week days.
Initial download of the metrics may take a while.