Fig. 4
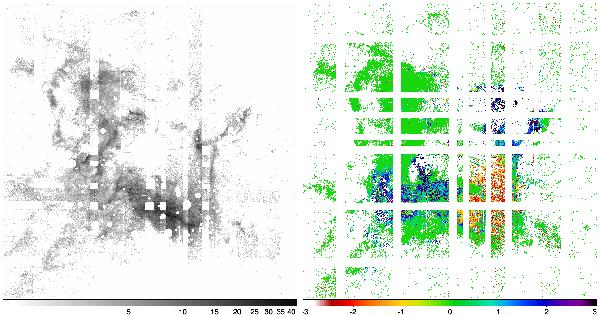
Left: map of the SNR of the linear polarization degree pL. The intensity scale is logarithmic. Right: difference in measured polarization degree pL(epoch2) − pL(epoch1), normalized to the combined local standard deviation of the two images. The field of view is 4′ × 4′, with north up and east to the left.
Current usage metrics show cumulative count of Article Views (full-text article views including HTML views, PDF and ePub downloads, according to the available data) and Abstracts Views on Vision4Press platform.
Data correspond to usage on the plateform after 2015. The current usage metrics is available 48-96 hours after online publication and is updated daily on week days.
Initial download of the metrics may take a while.