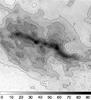
Fig. 17
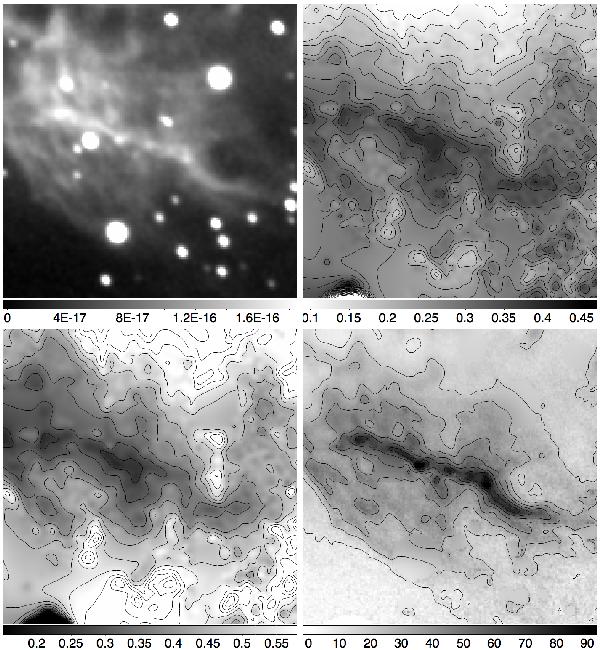
Enlargement of the ridge nebular feature located south of RS Pup. Top row: EMMI intensity image (left, W m-2 μm-1 sr-1, linear scale) and pL map (right, with 2.5% spacing contours starting at 0). Bottom row: altitude of the dust layer (left, in pc, with 0.05 pc contours) and dust column density (right, 1054 H arcsec-2, with 10 unit contours). The field of view is 44 × 44″, corresponding to 0.4 × 0.4 pc at the distance of RS Pup.
Current usage metrics show cumulative count of Article Views (full-text article views including HTML views, PDF and ePub downloads, according to the available data) and Abstracts Views on Vision4Press platform.
Data correspond to usage on the plateform after 2015. The current usage metrics is available 48-96 hours after online publication and is updated daily on week days.
Initial download of the metrics may take a while.