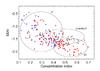
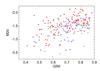
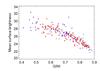
Fig. 8
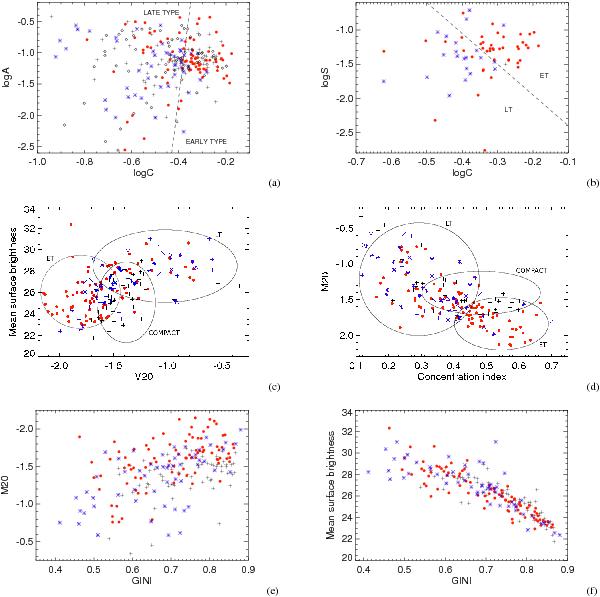
Top left: relation between asymmetry and Abraham concentration index. Red dots represent the early-type galaxies (E/S0, S0/Sa) classified with probabilities p1 ≥ 0.75, while the blue stars represent all late-type galaxies having p2 probabilities above 0.5. Black crosses represent compact objects (all sources with CLASS_STAR ≥ 0.9). Open diamonds are sources with 0.5 < p1 < 0.75, which might be either ET/LT or mergers (see Sect. 3.2). The dashed line separates the areas where most of the early- and late-type galaxies are located (right and left area from the dashed line, respectively). Top right: relation between the smoothness and Abraham concentration index. The dashed line separates the areas where most of the early- (on the right; red dots) and late-type (on the left; blue stars) galaxies are located. Relation between the mean surface brightness and M20 moment of light (middle left), and between the M20 moment of light and Abraham concentration index (middle right). Symbols are the same as on the previous two plots. High probability regions of finding any of three morphological groups (early-, late-, or compact sources) have been defined in both plots. Bottom left: relation between the M20 moment of light and Gini coefficient. See previous plots for symbols description. Bottom right: relation between the mean surface brightness and Gini coefficient. See previous plots for symbols description.
Current usage metrics show cumulative count of Article Views (full-text article views including HTML views, PDF and ePub downloads, according to the available data) and Abstracts Views on Vision4Press platform.
Data correspond to usage on the plateform after 2015. The current usage metrics is available 48-96 hours after online publication and is updated daily on week days.
Initial download of the metrics may take a while.