Fig. 7
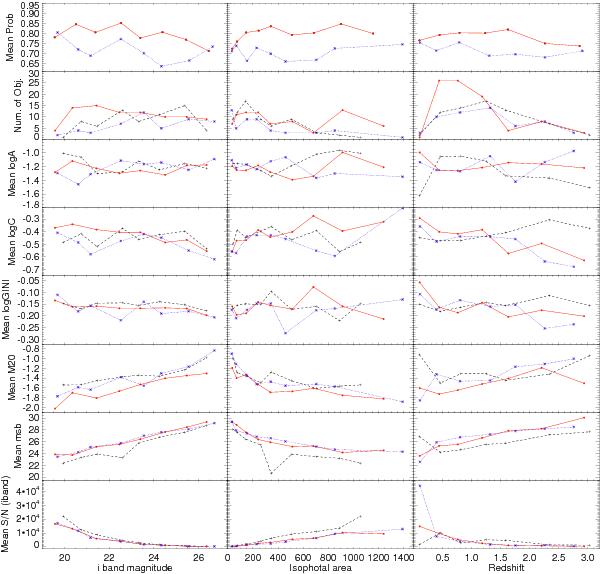
From top to bottom: relationship between mean values of galSVM probabilities, number of objects, asymmetry index, Abraham concentration index, Gini coefficient, M20 moment of light, mean surface brightness, and S/N in i band. From left to right: apparent magnitude in i′ band, isophotal area, and redshift. Compact objects are marked with black crosses and dotted lines, early-type galaxies with red spots and solid lines, and finally, late-type galaxies with blue stars and dashed lines.
Current usage metrics show cumulative count of Article Views (full-text article views including HTML views, PDF and ePub downloads, according to the available data) and Abstracts Views on Vision4Press platform.
Data correspond to usage on the plateform after 2015. The current usage metrics is available 48-96 hours after online publication and is updated daily on week days.
Initial download of the metrics may take a while.