Fig. 6
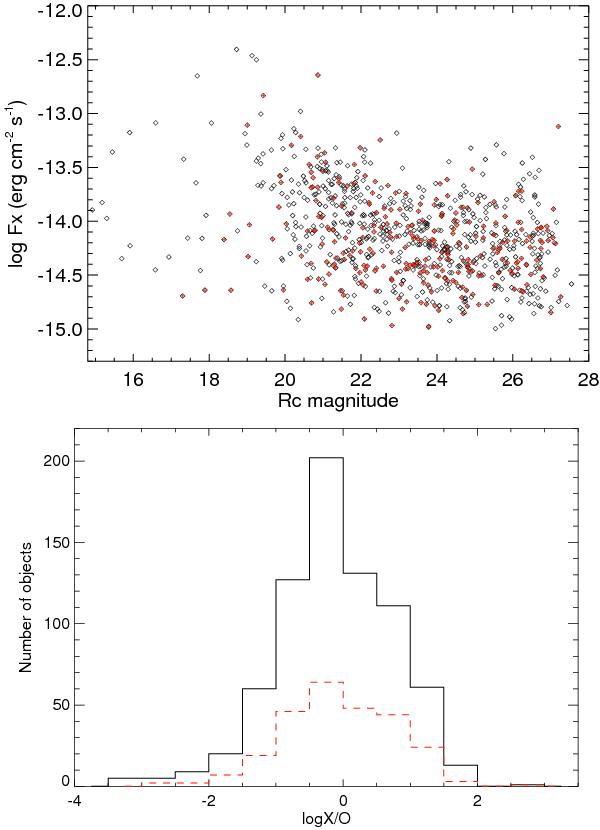
Top: relation between the X-ray flux in the 0.5–4.5 keV energy range and the AB Rc magnitude of the full matched sample (black diamonds) and the selected sample (red crosses). Bottom: distributions of the X-ray-to-optical flux ratios of both the full matched sample (black solid line) and the selected sample (dashed red line).
Current usage metrics show cumulative count of Article Views (full-text article views including HTML views, PDF and ePub downloads, according to the available data) and Abstracts Views on Vision4Press platform.
Data correspond to usage on the plateform after 2015. The current usage metrics is available 48-96 hours after online publication and is updated daily on week days.
Initial download of the metrics may take a while.