Fig. 3
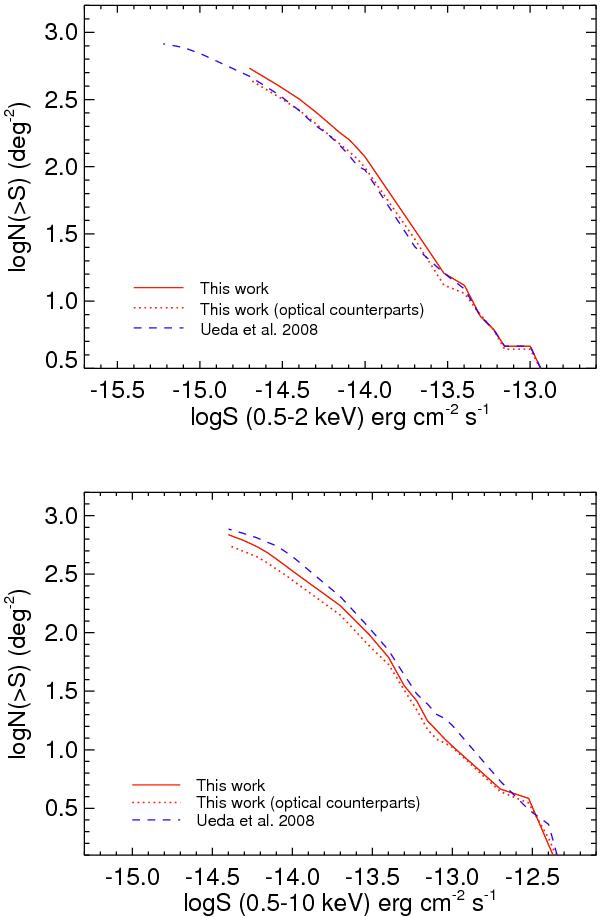
Cumulative log N − log S functions for X-ray sources detected in the SXDS field in the soft 0.5–2 keV (top) and total 0.5–10 keV (bottom) bands. Solid and dotted red lines show the data obtained in this work, presenting the full X-ray sample and the sample with optical counterparts, respectively. The dashed blue line presents the data obtained by Ueda et al. (2008) in the same bands.
Current usage metrics show cumulative count of Article Views (full-text article views including HTML views, PDF and ePub downloads, according to the available data) and Abstracts Views on Vision4Press platform.
Data correspond to usage on the plateform after 2015. The current usage metrics is available 48-96 hours after online publication and is updated daily on week days.
Initial download of the metrics may take a while.