Fig. 16
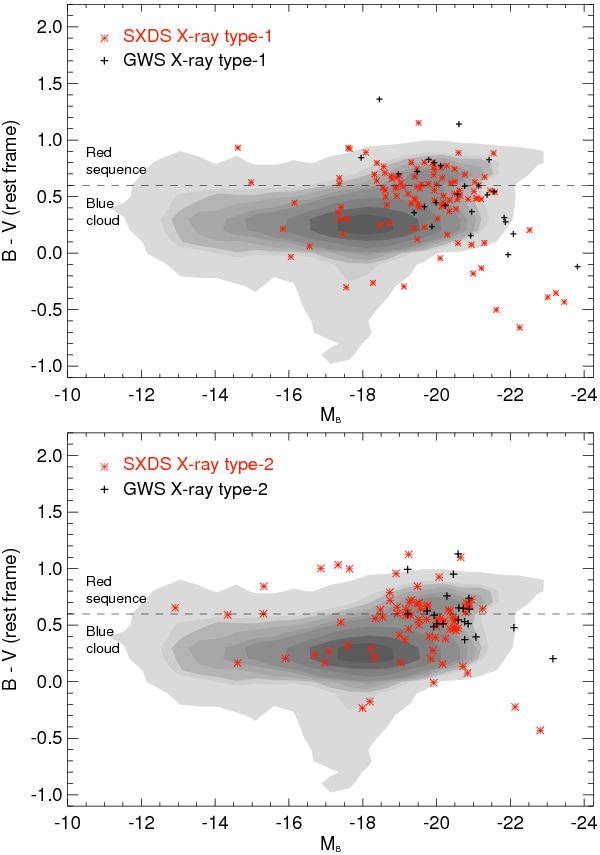
Colour–magnitude diagram showing the relation between the rest-frame B − V colour and the absolute magnitude in the B band for X-ray type-1 (unobscured; top) and X-ray type-2 (obscured; bottom) AGN, selected in the SXDS (red stars) and GWS (black crosses) fields. All sources with redshifts z ≤ 2.0 have been represented. AGN sample has been compared with the sample of normal galaxies selected in the CDF-S field (Wolf et al. 2001, 2004, 2008) represented with contours. The grey scales of the contours are scaled to the data, where the darkest and brightest show the highest and the lowest density of the sources, respectively. The dashed line shows the Melbourne et al. (2007) separation between the galaxies belonging to the red sequence (B − V > 0.6) or to the blue cloud (B − V < 0.6).
Current usage metrics show cumulative count of Article Views (full-text article views including HTML views, PDF and ePub downloads, according to the available data) and Abstracts Views on Vision4Press platform.
Data correspond to usage on the plateform after 2015. The current usage metrics is available 48-96 hours after online publication and is updated daily on week days.
Initial download of the metrics may take a while.