Free Access
Fig. 12
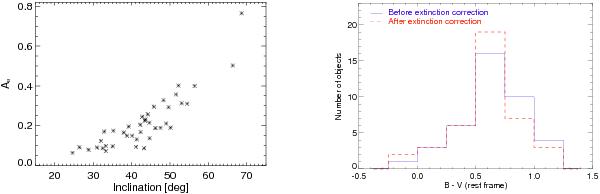
Left: relationship between the extinction AB measured in B band and inclination for late-type AGN host galaxies in the SXDS field. Right: histogram showing the distribution of B − V colour before (solid blue line) and after (dashed red line) extinction correction for late-type AGN host galaxies selected in the SXDS field.
This figure is made of several images, please see below:
Current usage metrics show cumulative count of Article Views (full-text article views including HTML views, PDF and ePub downloads, according to the available data) and Abstracts Views on Vision4Press platform.
Data correspond to usage on the plateform after 2015. The current usage metrics is available 48-96 hours after online publication and is updated daily on week days.
Initial download of the metrics may take a while.