Fig. 1
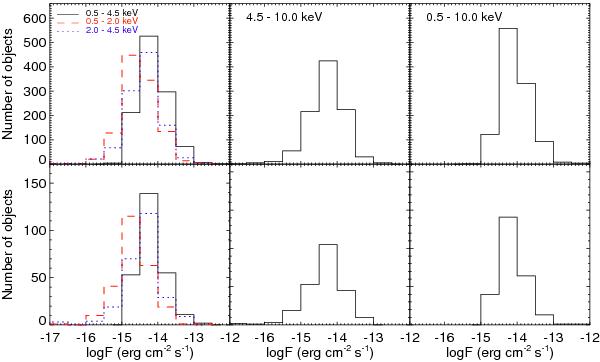
X-ray flux distributions for all 1121 X-ray detected sources (top) and for 262 objects with z ≤ 2.0 analysed in this paper (bottom; see Sect. 2.7). Flux distributions are represented in the 0.5–2.0 keV (dashed red line), 2.0–4.5 keV (dotted blue line), and 0.5–4.5 keV (solid black line) energy bands (left panels), 4.5–10.0 keV (middle panels), and 0.5–10.0 keV range (right panels).
Current usage metrics show cumulative count of Article Views (full-text article views including HTML views, PDF and ePub downloads, according to the available data) and Abstracts Views on Vision4Press platform.
Data correspond to usage on the plateform after 2015. The current usage metrics is available 48-96 hours after online publication and is updated daily on week days.
Initial download of the metrics may take a while.