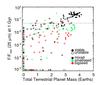
Fig. 8
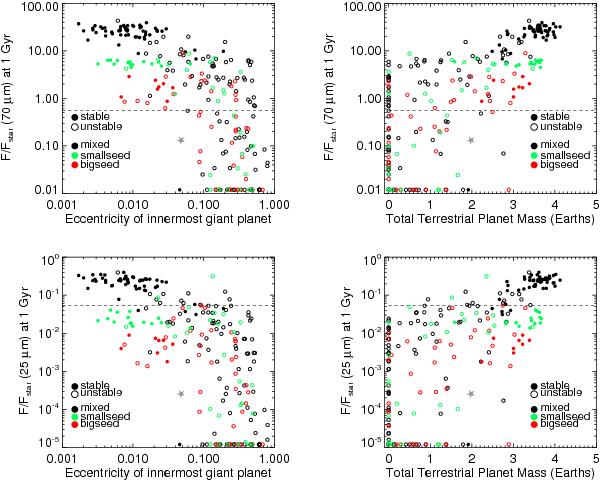
Correlations with the dust flux after 1 Gyr of dynamical and collisional evolution for the seeds simulations, as compared with the mixed simulations. The top panels show F/Fstar at 70 μm vs. the eccentricity of the innermost surviving giant planet (left) and the total mass in surviving terrestrial planets (right). The bottom panels show the same comparisons but at 25 μm. The mixed simulations are in black, the smallseed simulations in green, and the bigseed simulations in red. Filled circles represent stable simulations and open circles unstable simulations.
Current usage metrics show cumulative count of Article Views (full-text article views including HTML views, PDF and ePub downloads, according to the available data) and Abstracts Views on Vision4Press platform.
Data correspond to usage on the plateform after 2015. The current usage metrics is available 48-96 hours after online publication and is updated daily on week days.
Initial download of the metrics may take a while.