Fig. 3
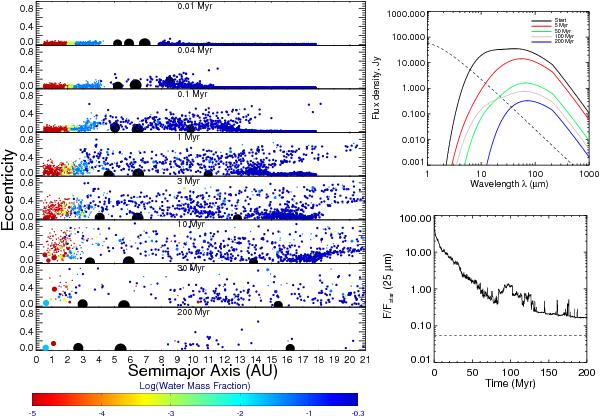
Evolution of a simulation with low-mass giant planets. Left: orbital eccentricity vs. semimajor axis of each body in the simulation. The size scales with the mass1/3 and the color corresponds to the water content, using initial values taken to solar system data (Raymond et al. 2004) and re-calculated during impacts by mass balance. The giant planets are shown as the large black bodies and are not on the same size scale. Top right: the spectral energy distribution of the dust during five simulation snapshots, as observed from a distance of 10 pc. The dashed line represents the stellar photosphere. Bottom right: the ratio of the dust-to-stellar flux at 25 microns as a function of time. The rough observational limit of the MIPS instrument on NASA’s Spitzer Space Telescope is shown with the dashed line (Trilling et al. 2008). A movie of this simulation is available online or at http://www.obs.u-bordeaux1.fr/e3arths/raymond/scatter_lowmass_54.mpg.
Current usage metrics show cumulative count of Article Views (full-text article views including HTML views, PDF and ePub downloads, according to the available data) and Abstracts Views on Vision4Press platform.
Data correspond to usage on the plateform after 2015. The current usage metrics is available 48-96 hours after online publication and is updated daily on week days.
Initial download of the metrics may take a while.