Fig. 2
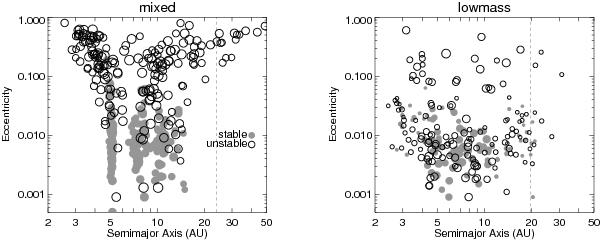
Eccentricity vs. semimajor axis for the surviving giant planets in the mixed (left panel) and lowmass (right) simulations. Black circles represent unstable simulations – defined as simulations in which at least one giant planet-planet scattering event occurred – and grey dots are stable simulations. The size of each circle is proportional to the logarithm of the planet mass. The dashed vertical lines represent the median outer edge of the planetesimal disk for each set of simulations. Note that the outer edge varied from simulation to simulation depending on the giant planet masses, from 20.6 to 27 AU (with a median of 23.7 AU) for the mixed simulations and 17.3 to 23.3 AU for the lowmass simulations (median of 19.7 AU).
Current usage metrics show cumulative count of Article Views (full-text article views including HTML views, PDF and ePub downloads, according to the available data) and Abstracts Views on Vision4Press platform.
Data correspond to usage on the plateform after 2015. The current usage metrics is available 48-96 hours after online publication and is updated daily on week days.
Initial download of the metrics may take a while.