Fig. 19
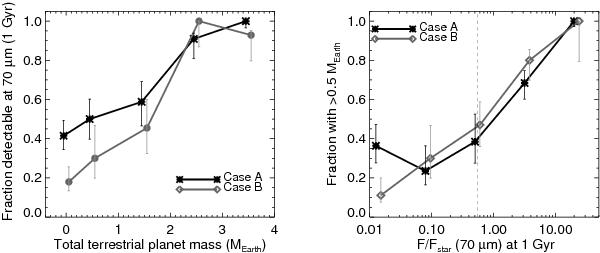
Left: the fraction of systems that would be detectable with Spitzer (F/Fstar(70 μm) ≥ 0.55 after 1 Gyr) as a function of the total mass in surviving terrestrial planets for cases A (black) and B (grey). This represents a horizontal slice through Fig 18. Right: the fraction of systems with 0.5 M⊕ or more in terrestrial planets as a function of F/Fstar(70 μm) ≥ 0.55 (1 Gyr) for cases A and B. Systems with F/Fstar < 10-2 are included in the bin at F/Fstar ≈ 10-2. The Spitzer detection limit is shown as the dashed line. This represents a vertical slice through Fig. 19.
Current usage metrics show cumulative count of Article Views (full-text article views including HTML views, PDF and ePub downloads, according to the available data) and Abstracts Views on Vision4Press platform.
Data correspond to usage on the plateform after 2015. The current usage metrics is available 48-96 hours after online publication and is updated daily on week days.
Initial download of the metrics may take a while.