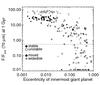
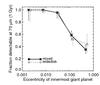
Fig. 11
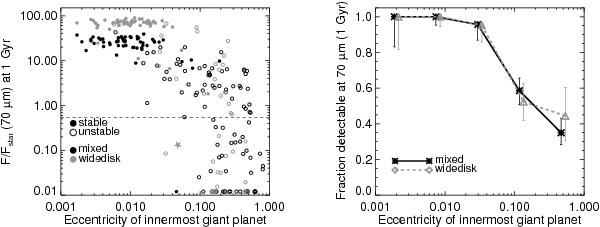
Left: the dust-to-stellar flux ratio at 1 Gyr at 70 μm vs. the innermost giant planet’s eccentricity for the widedisk (grey) and mixed (black) simulations. Filled circles represent stable simulations and open circles unstable ones. The solar system is shown with the grey star. Right: histogram of the fraction of systems that are detectable at 70 μm as a function of the innermost giant planet’s eccentricity; this is essentially a horizontal slice through the left panel.
Current usage metrics show cumulative count of Article Views (full-text article views including HTML views, PDF and ePub downloads, according to the available data) and Abstracts Views on Vision4Press platform.
Data correspond to usage on the plateform after 2015. The current usage metrics is available 48-96 hours after online publication and is updated daily on week days.
Initial download of the metrics may take a while.