Fig. 5
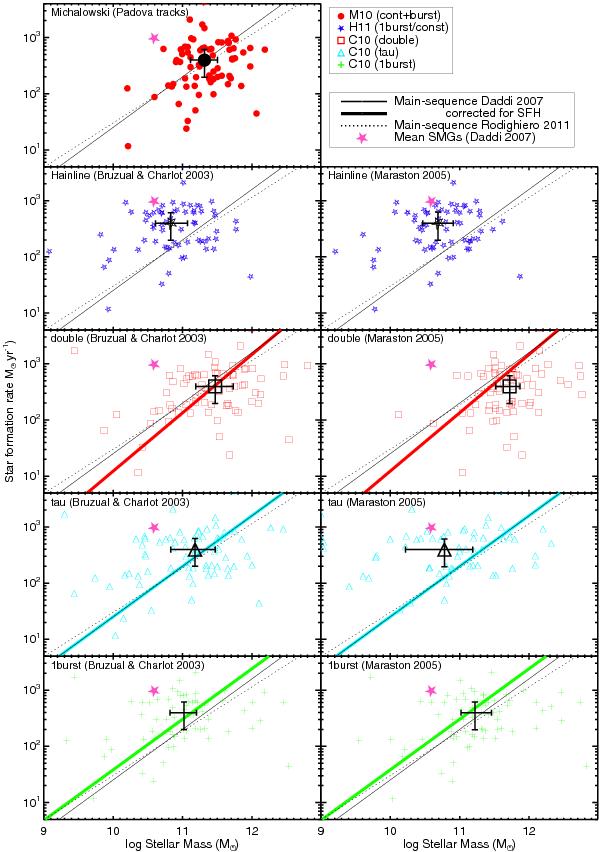
SFRs of SMGs as a function of stellar masses derived using the stellar population synthesis models of Bruzual & Charlot (2003, and Maraston (2005, . The symbols correspond to the stellar masses derived by M10 (red circles), H11 (blue stars) and our new estimates based on the SED modelling method of Cirasuolo et al. (2010, C10 for three alternative forms of star formation history (SFH): double-component model (red squares), exponentially-declining (tau) model (light blue triangles) and single burst (green pluses). The median values are shown as large black symbols with 3σ error bars. The “main-sequence” of star-forming galaxies at z ≃ 2 is shown as a solid line (Daddi et al. 2007) and dotted line (Rodighiero et al. 2011).The thick, coloured solid lines represent the “main-sequence” of Daddi et al. (2007) at z ≃ 2 corrected for the systematic difference in average stellar mass introduced by the self-consistent adoption of SFH to model SMGs in each panel (see Sect. 4 for details). All results have been converted to the Chabrier (2003) IMF. Unless the exponentially declining (tau model) SFH with the Maraston (2005) models are assumed, the SMGs are completely consistent with the high-mass end of this sequence. This agreement is essentially perfect for the M10 and double-component models. The magenta star shows the position of an average SMG as plotted by Daddi et al. (2007). Clearly, regardless of the assumed evolutionary stellar model or SFH, this supposed typical value of sSFR for SMGs is in fact unrepresentative of real SMGs.
Current usage metrics show cumulative count of Article Views (full-text article views including HTML views, PDF and ePub downloads, according to the available data) and Abstracts Views on Vision4Press platform.
Data correspond to usage on the plateform after 2015. The current usage metrics is available 48-96 hours after online publication and is updated daily on week days.
Initial download of the metrics may take a while.