Fig. 4
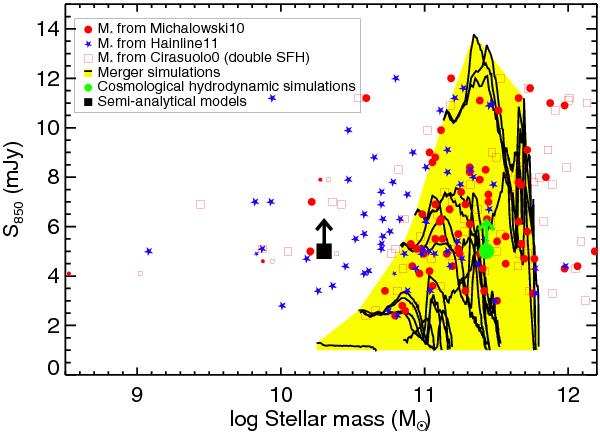
Submillimetre flux densities as a function of the stellar masses of SMGs. Solid lines represent the evolutionary tracks from the merger hydrodynamic simulations (Narayanan et al. 2009, 2010a,b; Hayward et al. 2011a,b) enclosed in the yellow shaded area, the big square represents the median stellar mass of 2 × 10¹⁰ M⊙ for SMGs with S850 > 5 mJy in the semi-analytical models (Baugh et al. 2005; Swinbank et al. 2008; González et al. 2011; Almeida et al. 2011), whereas the big circle corresponds to the median value derived by Davé et al. (2010) from the cosmological hydrodynamic simulations. Other symbols represent the observational data for SMGs with stellar masses from M10 (red circles), H11 (blue stars) and our new estimates based on C10 and double-component SFH (red squares). Small symbols indicate SMGs at z < 0.5. According to the hydrodynamic simulations, many of the stellar masses derived by H11 are too low to result in measurable submillimetre flux, while the stellar masses derived by M10 are consistent with the hydrodynamic simulation predictions (within the observational errors). Neither the H11, M10 or C10 stellar masses appear to agree, on average, with the median stellar mass predicted by the semi-analytic models.
Current usage metrics show cumulative count of Article Views (full-text article views including HTML views, PDF and ePub downloads, according to the available data) and Abstracts Views on Vision4Press platform.
Data correspond to usage on the plateform after 2015. The current usage metrics is available 48-96 hours after online publication and is updated daily on week days.
Initial download of the metrics may take a while.