Fig. 1
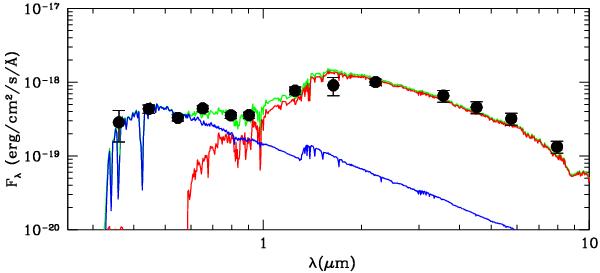
Spectral energy distribution (flux density vs. observed wavelength) of SMMJ123606.85+621021.4 at the spectroscopic redshift z = 2.509 fitted using the double-component star formation history method of Cirasuolo et al. (2010, C10. Black circles denote the data, red and blue curves are the SEDs of the old and young components, respectively, and the green curve is the sum of these two components. The older component dominates the near-IR light and the derived stellar mass, whereas the young component delivers almost all rest-frame ultraviolet flux density.
Current usage metrics show cumulative count of Article Views (full-text article views including HTML views, PDF and ePub downloads, according to the available data) and Abstracts Views on Vision4Press platform.
Data correspond to usage on the plateform after 2015. The current usage metrics is available 48-96 hours after online publication and is updated daily on week days.
Initial download of the metrics may take a while.