Fig. 2
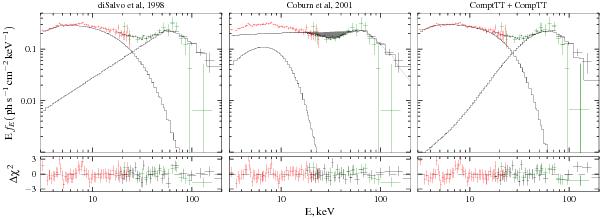
EfE spectrum of X Per observed by INTEGRAL. The best-fit spectra of the three different models discussed in the text and their residuals are shown. Data from ISGRI (black), JEM-X (red) and SPI (green) instruments were used. The contribution of the single model components is also shown. For the model by Coburn et al. (2001) (middle panel), we also show (shadowed area) the effect of including an absorption-like line, which is required by the specific continuum.
Current usage metrics show cumulative count of Article Views (full-text article views including HTML views, PDF and ePub downloads, according to the available data) and Abstracts Views on Vision4Press platform.
Data correspond to usage on the plateform after 2015. The current usage metrics is available 48-96 hours after online publication and is updated daily on week days.
Initial download of the metrics may take a while.