Fig. 9
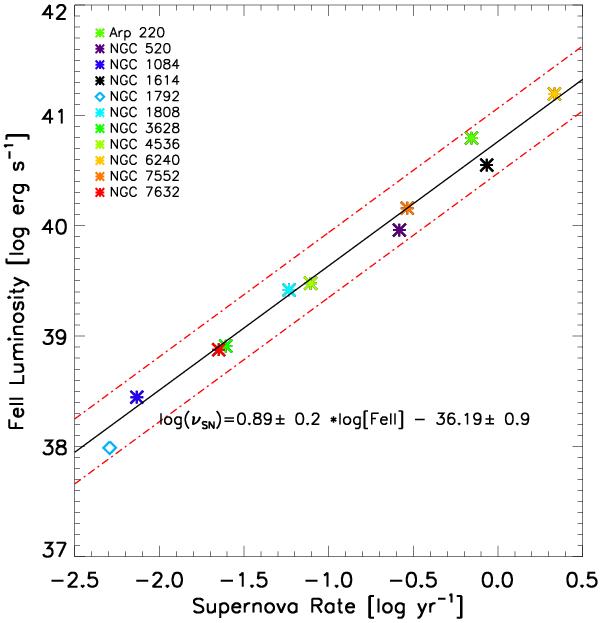
Integrated SNrate plotted against integrated [FeII] luminosity over the field of view. The black line is the least squares regression line, excluding NGC 1792. The red dotted lines represent the least squares regression line if the magnitude of extinction was overestimated respectively underestimated by a factor of two in optical depth.
Current usage metrics show cumulative count of Article Views (full-text article views including HTML views, PDF and ePub downloads, according to the available data) and Abstracts Views on Vision4Press platform.
Data correspond to usage on the plateform after 2015. The current usage metrics is available 48-96 hours after online publication and is updated daily on week days.
Initial download of the metrics may take a while.